This article will
explain how to send Squid log access queries to elasticsearch, then we will use
Kibana to build a cool & clean dashboard.
This article will
explain how to send Squid log access queries to elasticsearch, then we will use
Kibana to build a cool & clean dashboard.
Run squid
- You can follow our instructions to install and run squid from our repository in Github
Make sure you do the following:
- Your running os is Ubuntu
- Run Squid 5
- Add self-signed certificate to client browser
Reconfigure squid :
- Run this command to add new line to configuration file:
docker exec -d {container_name} sh -c 'echo "access_log tcp://<Logstash-server>:1025" >> /etc/squid/squid.conf'
Replace <Logstash-server> with the ip of Logstash host in this case it is
172.17.0.1
For example in squid5:
docker exec -d squid5_proxy sh -c 'echo "access_log tcp://172.17.0.1:1025" >> /etc/squid/squid.conf"
- Reconfigure squid with new configuration with this command:
docker exec -d {container_name} } sh -c 'squid -k reconfigure'
for example in squid5:
docker exec -d squid5_proxy sh -c 'squid -k reconfigure'
The particularity is we forward access logs to a TCP server located at
logstach on port 1025.
Setup ELK Stack
Prerequisites
Ubuntu Server with 20.04 LTS
JDK
2 CPU and 4 GB RAM
Open Ports 9200, 5601, 5044
Install JDK on Ubuntu
Run this command:
sudo apt-get install openjdk-11-jdk wget apt-transport-https curl gnupg2 -y
Elasticsearch
1- Download elasticsearch
- open new terminal
- run these commands:
wget https://artifacts.elastic.co/downloads/elasticsearch/elasticsearch-8.4.2-linux-x86_64.tar.gz
tar -xzf elasticsearch-8.4.2-linux-x86_64.tar.gz
cd elasticsearch-8.4.2/
2- Configure elasticsearch
Inside config directory edit elasticsearch.yml file with this configuration:
- Go to Network section and uncommnet network.host and replace your localhost
network.host: localhost
- Add the below line in Discovery section also
discovery.type: single-node
- Modify this setting with false or add it if not exists
        # Enable security features

        xpack.security.enabled:false
3- Run elasticsearch
- Run this command to
run elasticsearch inside elasticsearch directory
./bin/elasticsearch
Note: keep the current terminal open while elasticsearch are running
- Enter below command in new terminal to check elasticsearch is running by sending HTTP request:
curl -X GET "localhost:9200"
output
{
"name" :
"mahmoud-virtual-machine",
"cluster_name" :
"elasticsearch",
"cluster_uuid" :
"Ezvb_-4ITeGz-g_SW9sHqQ",
"version" : {
"number" : "8.4.1",
"build_flavor" : "default",
"build_type" : "tar",
"build_hash" :
"2bd229c8e56650b42e40992322a76e7914258f0c",
"build_date" :
"2022-08-26T12:11:43.232597118Z",
"build_snapshot" : false,
" lucene_version" : "9.3.0",
"minimum_wire_compatibility_version" :
"7.17.0",
"minimum_index_compatibility_version"
: "7.0.0"
},
"tagline" : "You Know, for
Search"
}
Kibana
1- Download Kibana
- open new terminal
- run these commands:
curl -O https://artifacts.elastic.co/downloads/kibana/kibana-8.4.2-linux-x86_64.tar.gz
tar -xzf kibana-8.4.2-linux-x86_64.tar.gz
cd kibana-8.4.2/
2- Configure Kkibana
Inside config directory edit kibana.yml file with this configuration
Uncomment the below lines
server.port: 5601
server.host:"0.0.0.0"
elasticsearch.hosts:["http://localhost:9200"]
3- Run Kibana
- Run this command to start kibana:
./bin/kibana
Note: keep the current terminal open while kibana are running
- Enter this URL http://localhost:5601 in your web browser to open kibana interface.
logstash
1- Download logstash
- open new terminal
- run these commands:
curl -O https://artifacts.elastic.co/downloads/logstash/logstash-8.4.2-linux-x86_64.tar.gz
tar -xzf logstash-8.4.2-linux-x86_64.tar.gz
cd logstash-8.4.2/
2- Configure Logstash With squid Logs
Download this logstash.conf =>
you can edit elasticsearch host and index name, but you can keep the default values as is.
3- Run Logstash
· Run this command to start Logstash
sudo bin/logstash -f <logstash.conf path>
Replace <logstash.conf path> with the absolute path to logstash.conf
Note: keep the current terminal open while logstash are running
Create kibana dashboard
Open kibana on your web browser example: localhost:5601
create a data view of logs index
- Open the main menu, then click Stack Management > Data Views.
- Click Create data view.
- Start typing in the name field - the name in logstash.conf file- , and kibana looks for the names of indices, data streams, and aliases that match your input.
In left bar under Analytics click to dashboard then create dashboard.
Select squid index that you created then create any visualization dashboard that you need
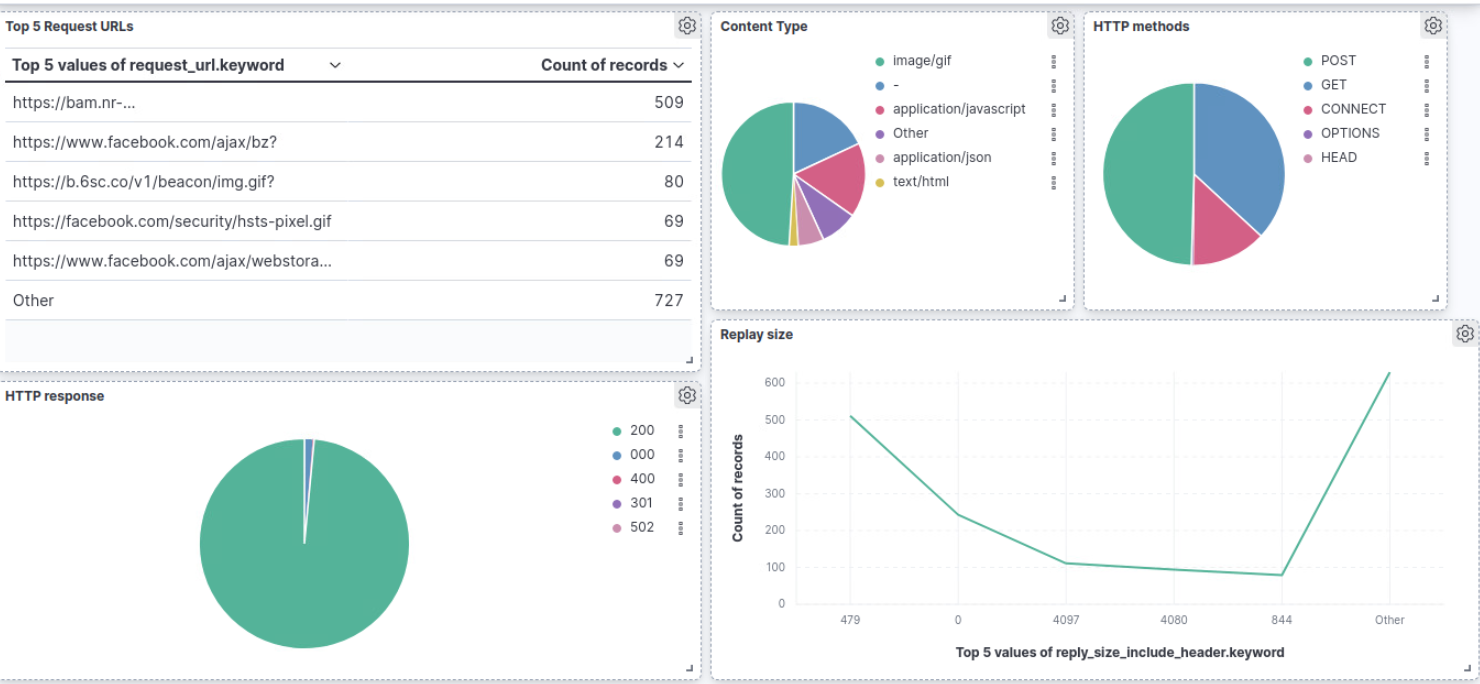
More information about create kibana dashboards: Create your first dashboard
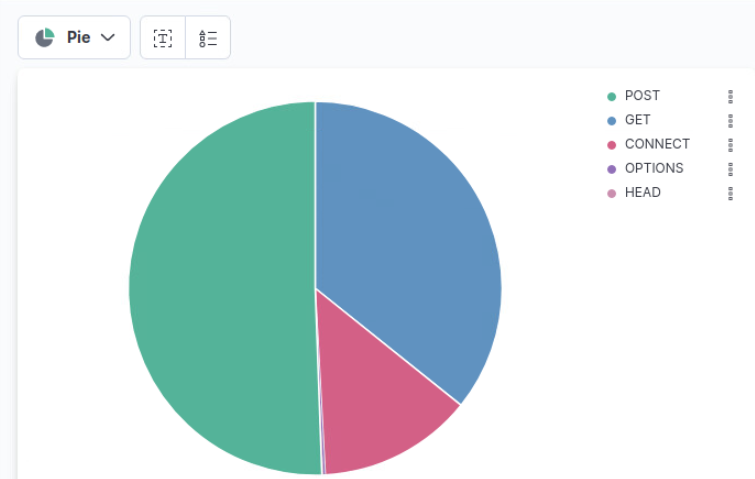
Example : create Pie chart of http methods
On left bar under available field select http_method.keyword (drag it and drop in the center)
From Visualization type select Pie
Result view